Software tools
GenDB
Here, we give a short description of selected GenDB functionalities. For a general overview of GenDB, please refer to the GenDB homepage.
System requirements for GenDB 2.4:
- A HTML 4.x compatible web browser.
- A screen resolution of at least 1280x1024.
- Please enable Javascript.
- Please enable Cookies.
- Please enable Popup-Windowsfor this site.
- The system has been tested with Netscape >=7, Mozilla >=1.1, Firefox >= 1.0, and Konqueror
- We recommend using the latest version of Firefox.
From the portal page www.rhizogate.de select the GenDB button.
This starts a user session for the RhizoGATE GenDB web project. The contig view of GenDB is presented (screenshot 1). Select the contig for a specific replicon from the 'Contigs' entry in the main menu. The coding regions are shown in a colour code denoting COG classes. Transposon insertions, DNA fragments, and oligonucleotide probes are shown on the middle line. Operons are indicated as frames.
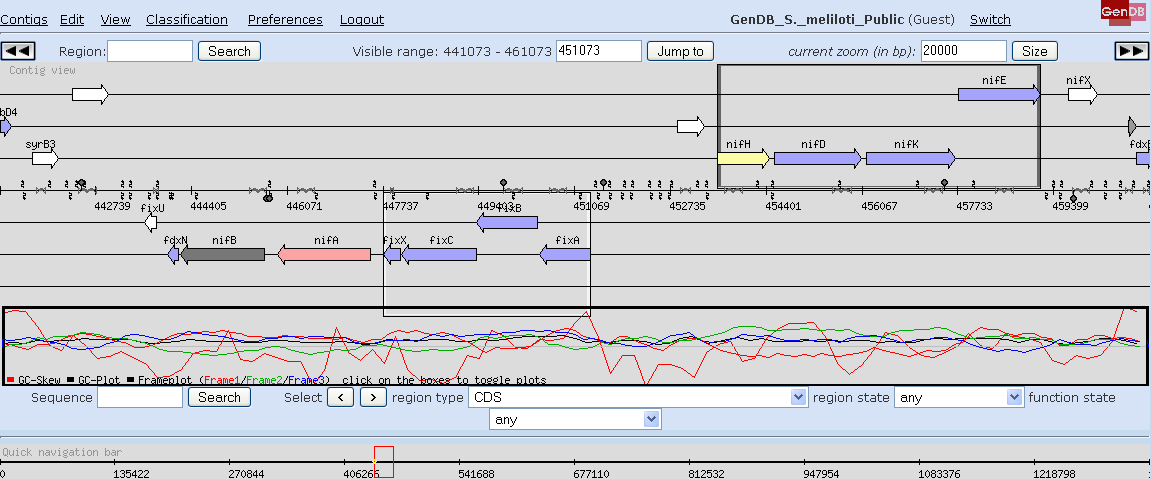
Screenshot 1
In the 'Edit' menu select the 'Search' entry. Please enter your search term in the search form that will show up according to screenshot 2. Hit the 'Search' button. 'Name' is a unique GenDB ID corresponding to the region tag (e.g. SMa0825). This field corresponds to the 'Region' search field in the bar above the main contig view. A gene of interest can be searched either using this field or the 'Gene name' field (enter an existing gene name, e.g. nifH, here). If this is unsuccessful, choose 'More options' and search using the 'Aliases' field. You may search for coding regions but also for all types of other regions that are chosen on the left in the 'More options' window.
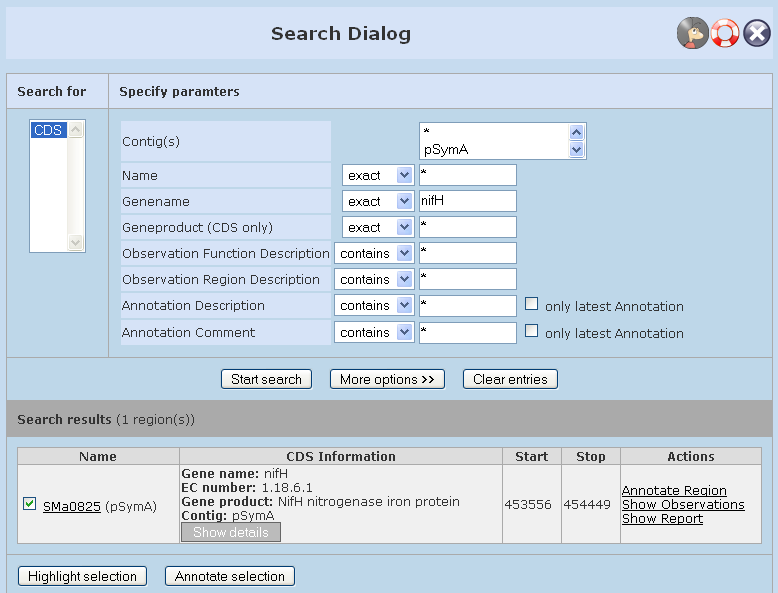
Screenshot 2
The matching genes are presented, please select the link to a gene from the result list. This selects the coding sequence with the corresponding gene as an active region. It will be centered in the main contig view and all other region specific frames of the web interface show the information available for this gene/region.
GenDB also offers the KEGG Pathway visualization. Please select 'Classification', 'KEGG' from the main menu of the GenDB web interface. This will open up the KEGG perspective of GenDB in a novel window. Please select a pathway (e.g. citrate cycle) from the list on the left. The pathway is generated (screenshot 3).
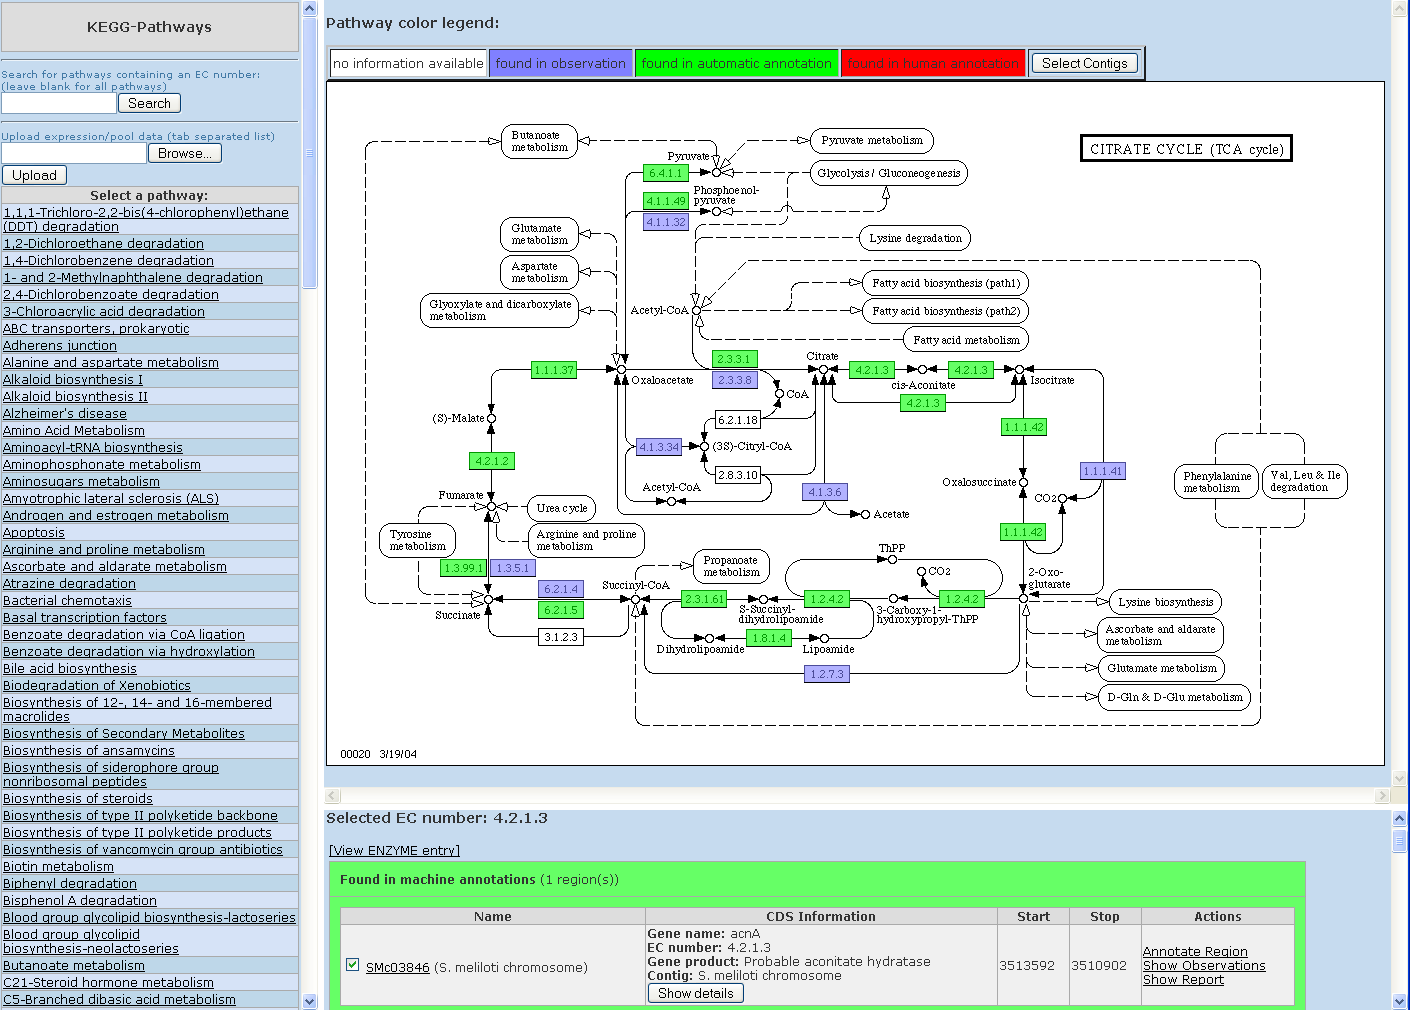
Screenshot 3
You may obtain the name and the insertion site of a transposon mutant by mousing over and placing the arrow tip directly on the transposon symbol in the main contig view. Additional information can be obtained by clicking on the symbol and on 'show mutation' (screenshot 4).
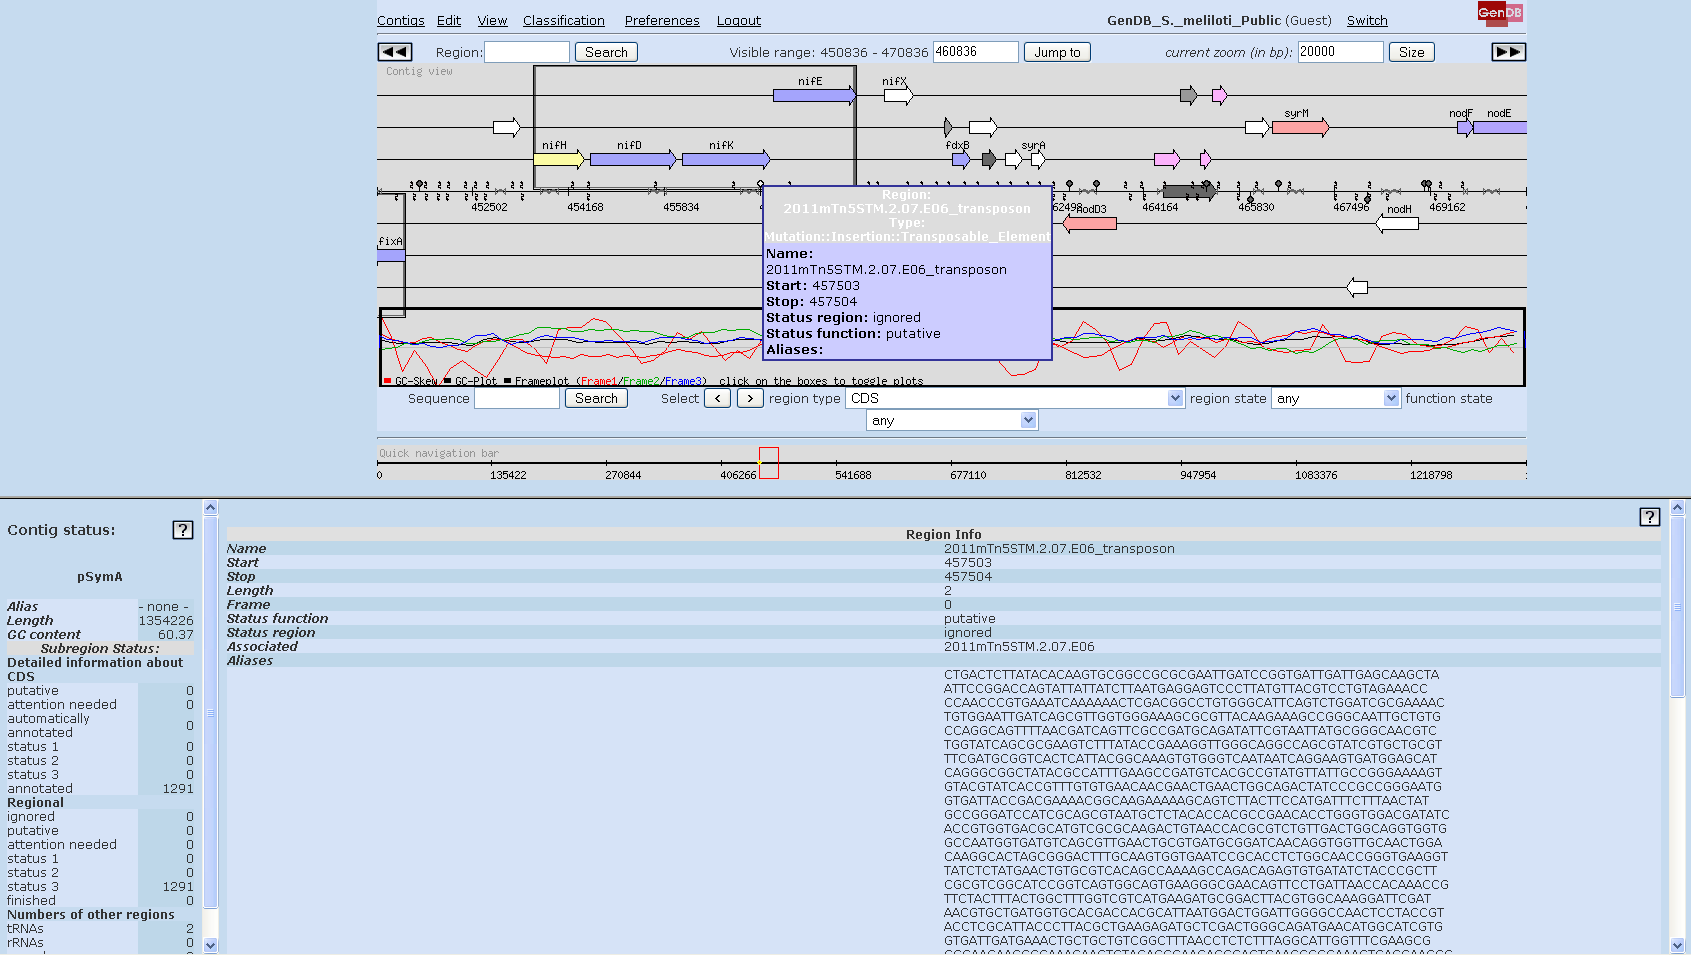
Screenshot 4
EMMA
Here, we give a short description of selected EMMA functionalities. For a general overview of EMMA, please refer to the EMMA homepage and the EMMA Project Wiki.
System requirements for EMMA 2.4:
- A HTML 4.x compatible web browser.
- A screen resolution of at least 1280x1024.
- Please enable Javascript.
- Please enable Cookies.
- Please enable Popup-Windowsfor this site.
- The system has been tested with Netscape >=7, Mozilla >=1.1, Firefox >= 1.0, and Konqueror
- We recommend using the latest version of Firefox.
From the portal page www.rhizogate.de select the EMMA button. This starts a guest session for the EMMA project in RhizoGATE.
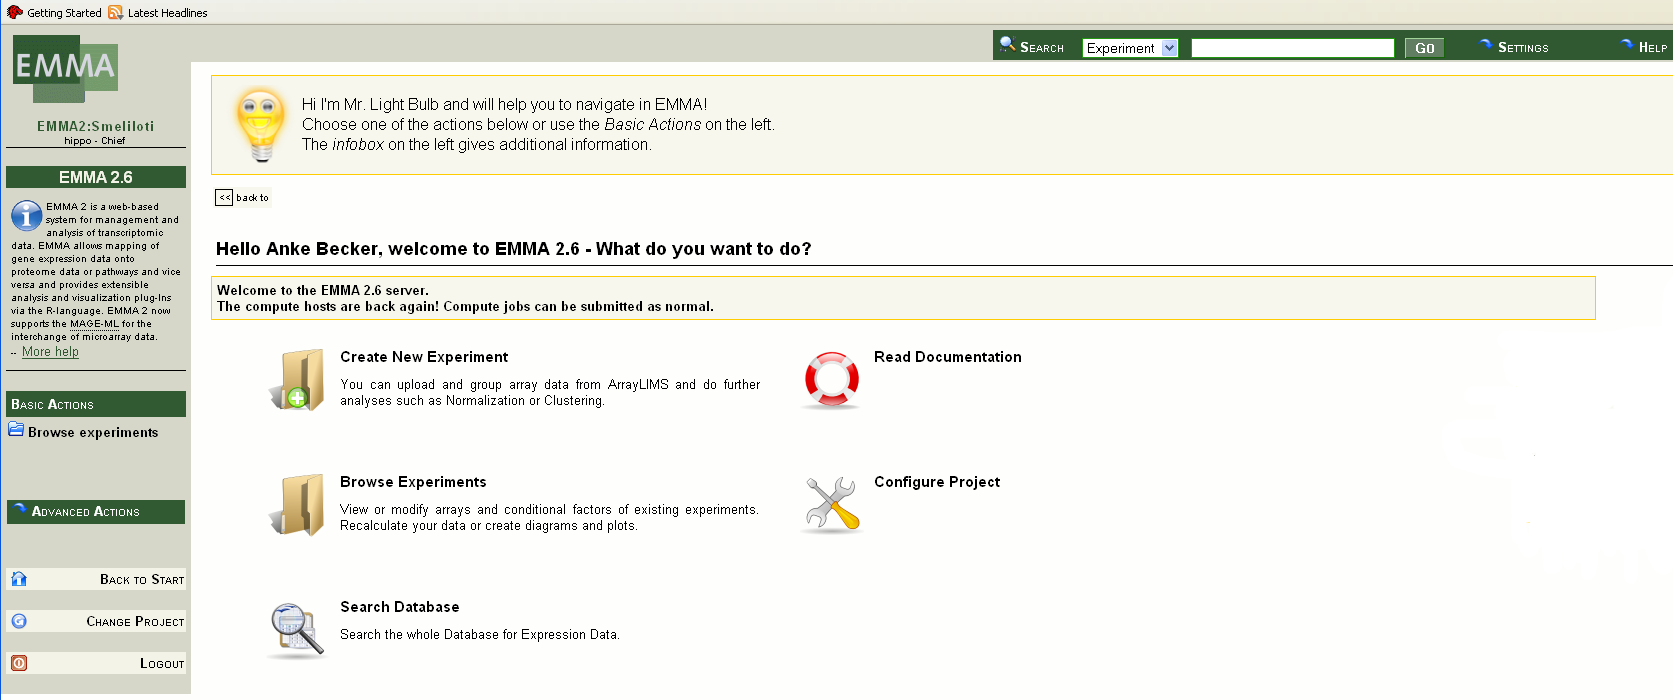
Screenshot 5
Select 'Browse Experiments' in the main window of EMMA. This generates a list of available microarray experiments for the current user.
Select an experiment (e.g. Rm1021wt_culture_time_course) by clicking on the experiment name. The experiment overview page is generated presenting the 'Basic description' and the 'Analysis Results' of the experiment (screenshot 6).
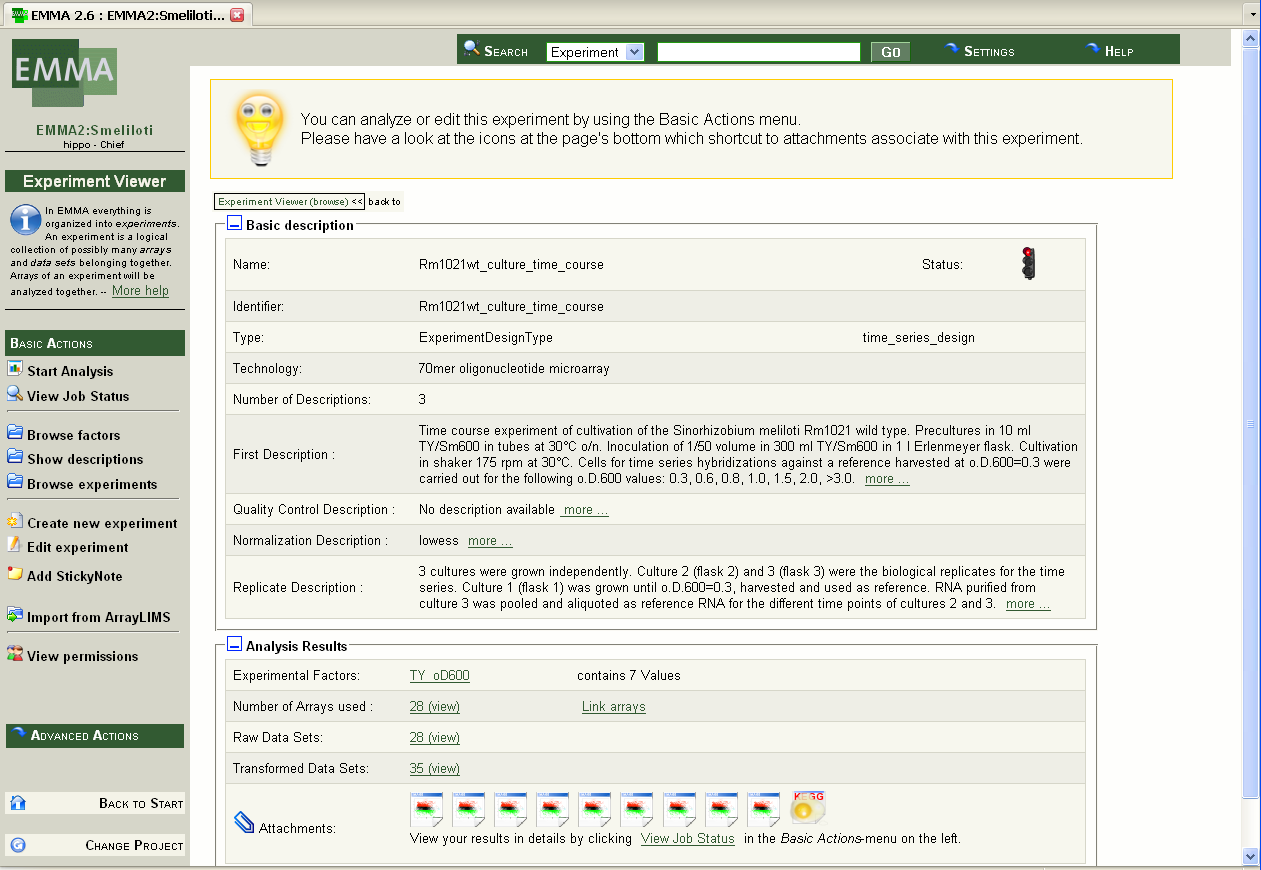
Screenshot 6
Click on the Transformed Data Sets. A list of these data sets will appear. Choose one data set (e.g. 'COMPUTED:SignificanceTest1495' on page 2) checking the box and click on 'Show Data Set(s)' in the 'Show' window. A window with the data set will appear (screenshot 7).
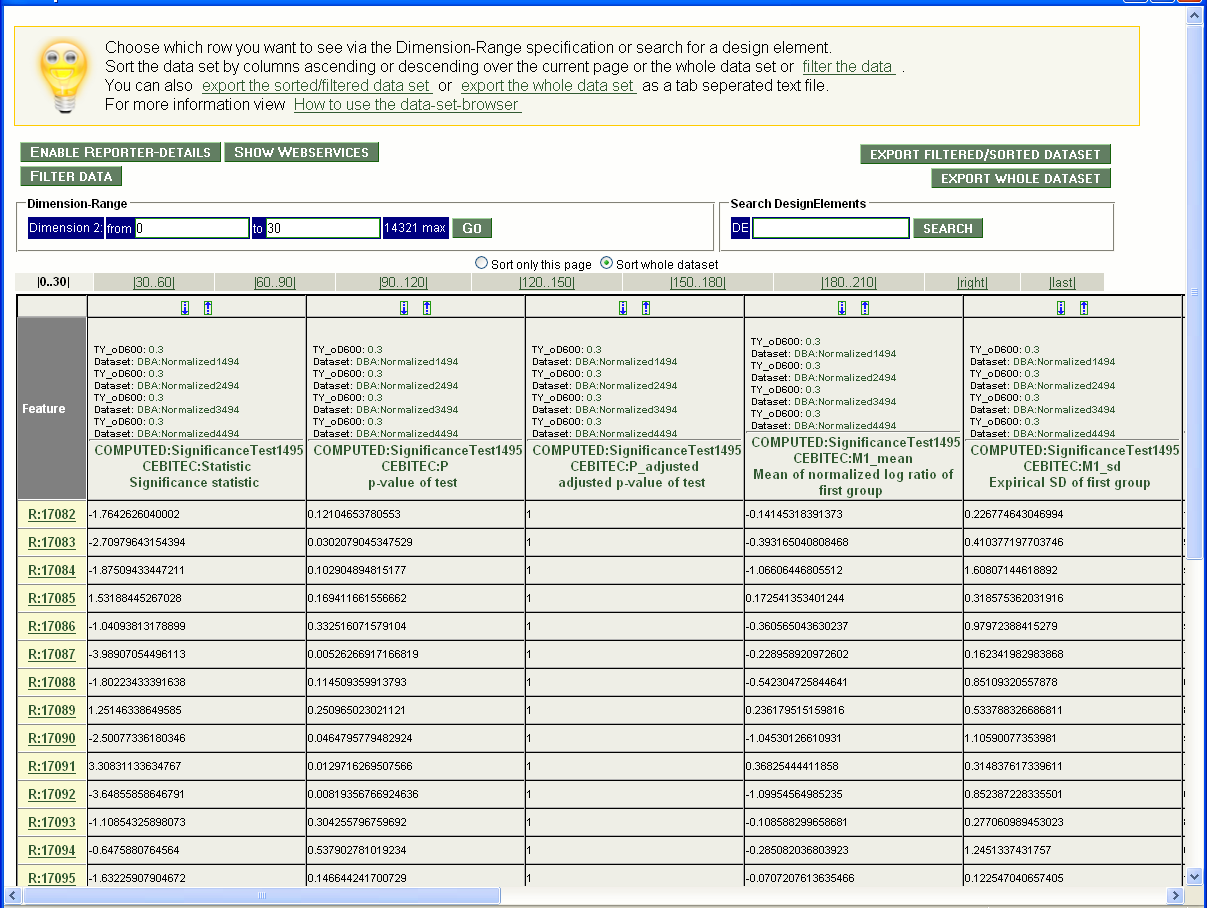
Screenshot 7
To view KEGG pathways, navigate back to the experiment overview page (screenshot 6) using the 'Return to experiment' button. Click on the KEGG button at the bottom of the experiment overview page to view the log-ratio changes of the measured transcripts for a specific pathway. Please select one pathway , e.g. 'Citrate cycle' from the alphabetic list of KEGG pathways (screenshot 8).
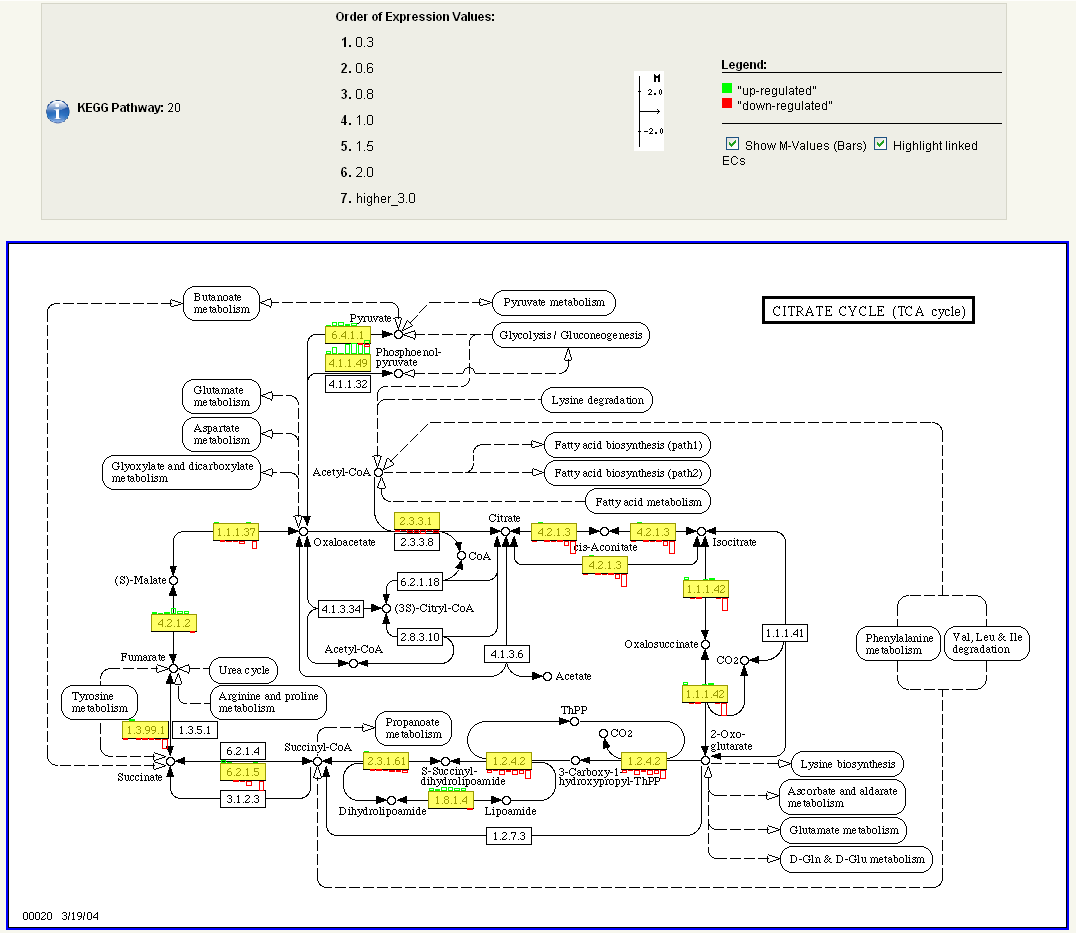
Screenshot 8
In order to obtain a detailed regulation and expression report (screenshot 9) for a specific gene that is present in the KEGG pathway, please click on the box with the respective E.C. number, e.g. EC-Number 1.1.1.42.
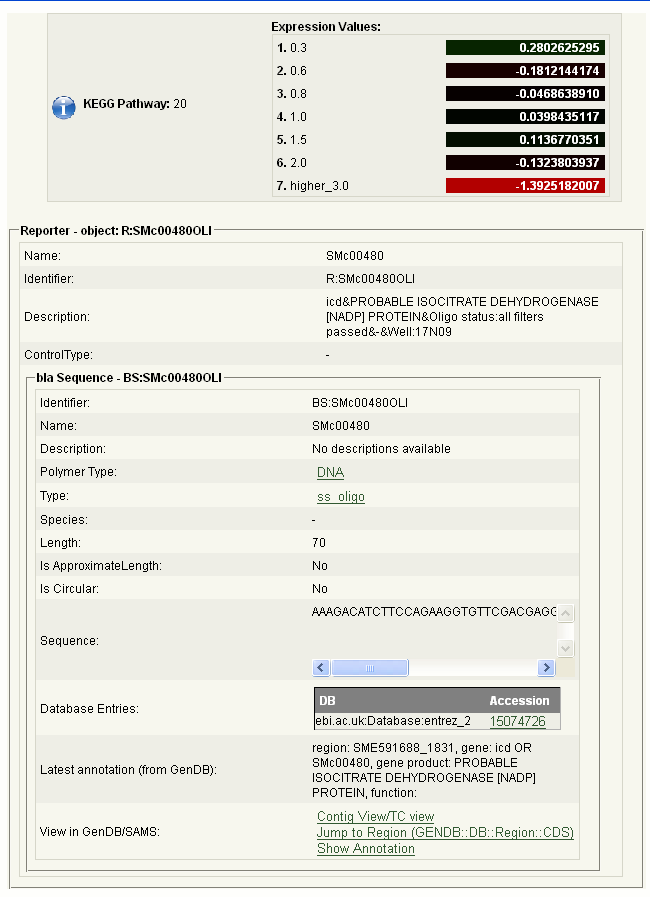
Screenshot 9
The M/A plot in EMMA provides a starting point for the interactive analysis of genes that show a different expression for varying experimental conditions. Please navigate back to the experiment overview page (screenshot 6) by clicking on 'Return to experiment' and select a 'M/A-plot' button (located at the bottom of the page). The M/A plot is shown (screenshot 10). By clicking 'Load spot information' in the 'Basic Menu' on the left, additional informations for the reporters are retrieved. Afterwards, the M/A-plot is rendered interactive and will present the reporter ID for every spot touched with the mouse cursor.
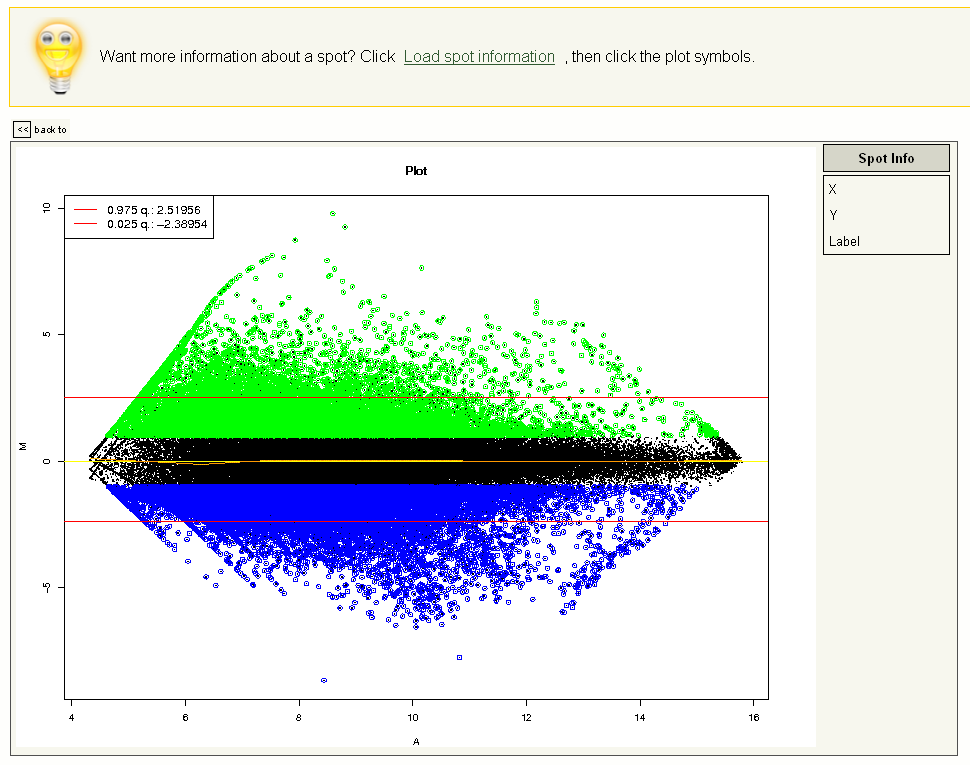
Screenshot 10
IGetDB
Here, we give a short description of selected IGetDB functionalities. For a general overview of IGetDB, please refer to the IGetDB homepage (discontinued).
System requirements for IGetDB 1.2:
- A HTML 4.x compatible web browser.
- A screen resolution of at least 1280x1024.
- Please enable Javascript.
- Please enable Cookies.
- Please enable Popup-Windowsfor this site.
- The system has been tested with Netscape >=7, Mozilla >=1.1, Firefox >= 1.0, and Konqueror
- We recommend using the latest version of Firefox.
From the portal page www.rhizogate.de select the IGetDB button.
The RhizoGATE IGetDB data warehouse can be used to extract diverse data, for example, expression information.
Follow the fields in the database marked in red to extract expression information corresponding to genes with a particular annotation. Please note that in the current version, you cannot search for up- and downregulated genes at the same time, so you have to execute two seperate search queries. Once you have finished, preview and export your results to spreadsheet software.
The search options for the EMMA expression data are: M>: enter a value to select upregulated genes above a certain log2 cutoff (e.g. 1.0 will return at least 2-fold induced genes); M<: enter a value to select downregulated genes below a certain log2 cutoff (e.g. -1.0 will return at least 2-fold repressed genes); A>: enter a value to select genes above a certain log2 level of expression (reasonable cutoffs are 5-8, but this heavily depends on the scan parameters, so you probably want to skip this and rely on p-values); p<: select a maximum p-value to judge the significance of gene expression; n>: select a minimal number of replicate spots the expression values shall be based on. A reasonable cutoff is 2-4, but also this depends on the experiment settings.
Please note that the search queries require some time in particular steps, for example, during the selection of experiments and experimental factor/values (i.e. conditions profiled). Please be patient! The search queries are performed on the fly and have to work through different databases for data retrieval. This makes sure that for each query you always obtain the most recent collection of publicly available experiments as well as the most recent annotations.
Publisher's details
Responsible Person:Prof. Dr. Anke Becker
Please contact us by e-mail to
Anke.Becker![]() biologie.uni-freiburg.de if there
are mistakes, errors or questions. Any error report is welcome!
Check again in the near future for added functionality and updated
information.
biologie.uni-freiburg.de if there
are mistakes, errors or questions. Any error report is welcome!
Check again in the near future for added functionality and updated
information.
External link disclaimer.
Some links provided on these pages will lead you to external web pages (in a new window of your browser) that we did not implement. We do not have any influence on the contents of these web pages, they are provided for your information only. Although carefully checked, we are not responsible in any way for contents or layout of these pages. We are also not responsible for electronic messages that you may receive from the owners of these web pages.
University of Freiburg
Department of Biology
Prof. Dr. Anke Becker
79104 Freiburg
Germany